Sentinel-2 Semantic Earth Observation Data and Information Cube for Austria (Sen2Cube.at) is the
world's first prototype of a semantic EO data cube covering all of Austria and includes all
available Sentinel-2 images since Sentinel-2A was launched in 2015.
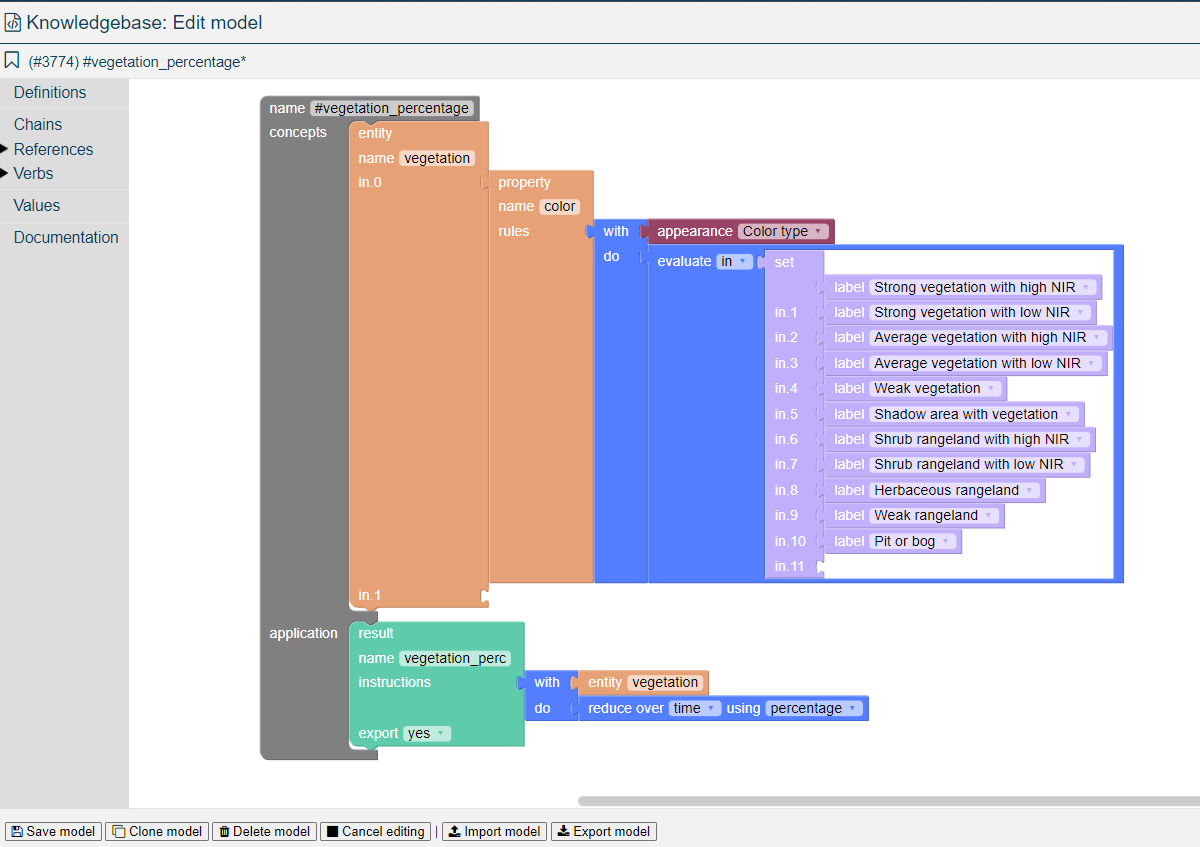
The multi temporal information used in this web application are the percentage of vegetation
observed per pixel
in
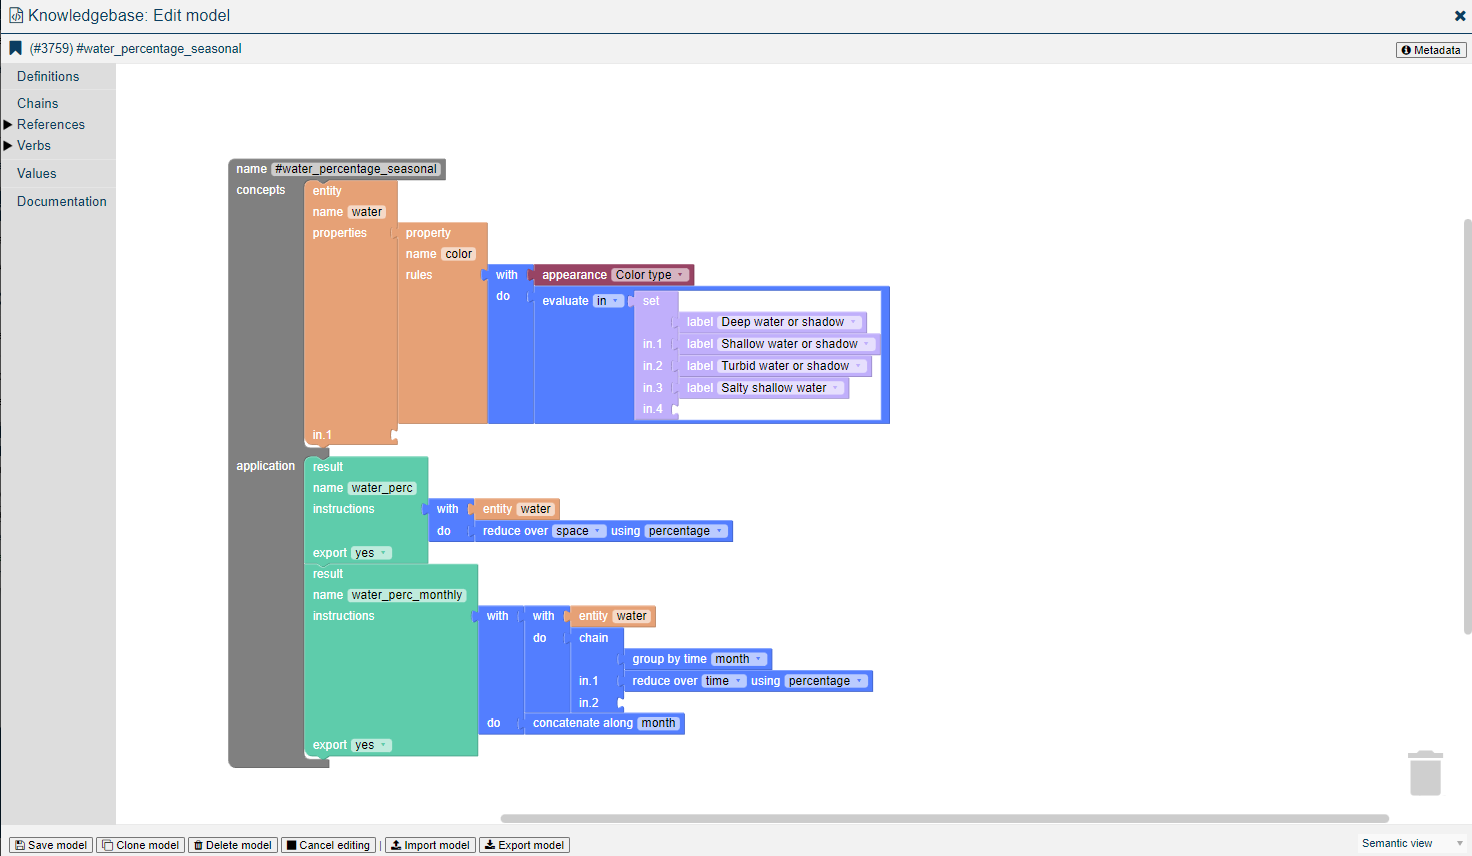
Salzburg region of Austria for 6 years (2016-2021) and percentage of water occurrence for the border
region of Turkey and Syria for 2022.
Around 2178 Sentinel-2 scenes were used to get the information from
Sen2cube.at using knowledge model shown in the below image.
And for Syrian and Turkish border region, 140 different images were used.
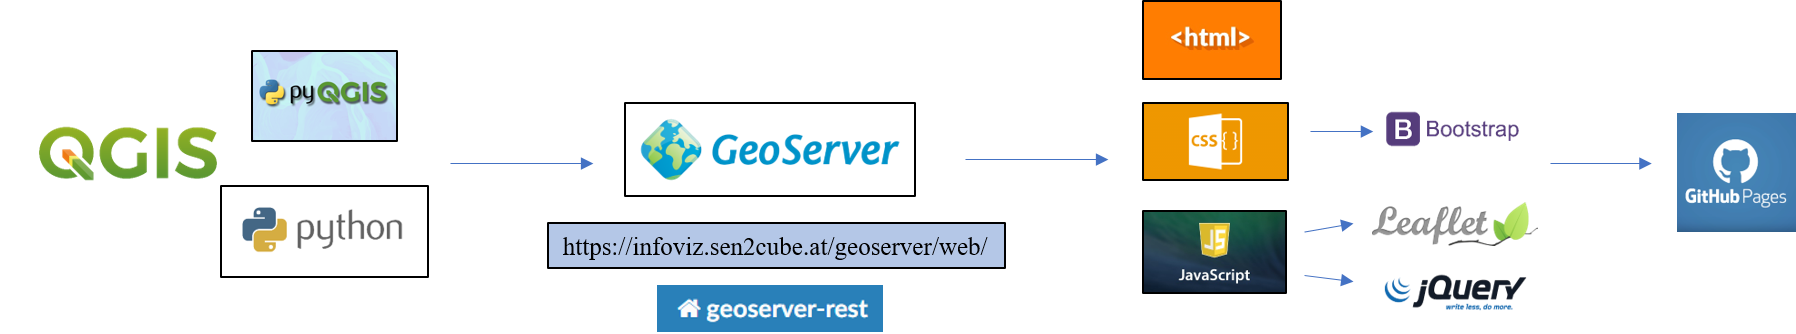
The information, basically rasters, that we obtained from Sen2cube.at was then pre processed in Python and PyQGIS, which is a python environment inside QGIS. The pre processing was done to get the rasters ready for visualization. The pre processing steps involved binary thresholding of individual rasters, adding the rasters to a single rasters, generating individual rasters based on unique values, generating style files for individual rasters and finally generating a single style file for all the rasters. To make the process reproducible and due to the large number of rasters involved, the preprocessing step was dealt mostly with Python scripting.

After the rasters were ready for visualization, they were hosted on Geoserver, which is an open source server based on Java to store, edit and share geospatial data. Considering the amount of data, the entire process of uploading the rasters to Geoserver, uploading the style files and then applying and publishing those styles to respective rasters were done with geoserver-rest, a Python package based on Geoserver REST API.
Finally, the visualization platform was built using HTML, CSS and Javascript. Leaflet, a open source
mapping
JavaScript library for mapping was primarily used to display the geospatial content. Bootstrap,
another free and open source CSS framework was used to make the website responsive. In addition to
native features of Leaflet and JavaScript, some other plugins were also used to add additional
features.
Following tools and technologies were used to built the web platform for visualization of the multi
temporal information.