About the app
This web app aims to demonstrate the visualization of multi-temporal information. The semantically enriched Earth Observation (EO) time series information was obtained from Sentinel-2 Semantic Earth Observation Data and Information Cube for Austria (Sen2Cube.at), which is the world’s first prototype of a semantic EO data cube.
The approach of visualization used this application is slightly different from traditional ways.
In the first case of yearly vegetation in Salzburg from 2016-2021, users can visualize the presence or absence of vegetation in selected years and the selected threshold percentage in one layer. This is challenging in GIS softwares like ArcGIS Pro and QGIS because the RGB channel can handle only 3 bands. Users can select any year(s) and the resulting layer will be pixels that were vegetated in the selected year(s) but not in the unselected years.
Consider the following pixel values for two years, 2016 and 2017. And consider the user takes 20%
as the threshold percentage.
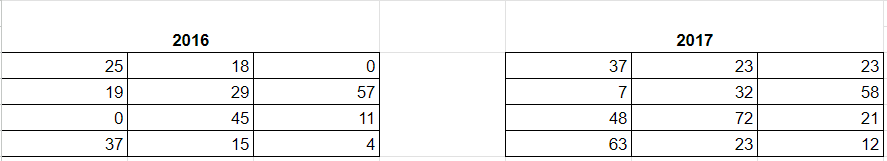
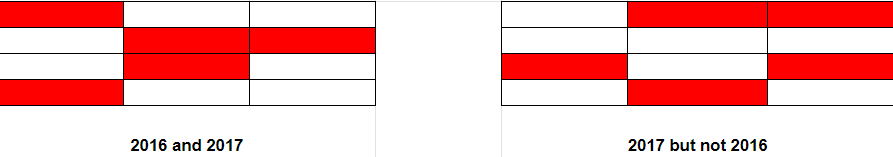
If the user selects both 2016 and 2017, those pixels that were vegetated in both the years
with threshold greater or equal to 20% will be displayed. But if the user selects 2017 but not
2016, those pixels that were vegetated in both 2016 and 2017 with 20% threshold will not be
displayed. Only the pixels that were vegetated exclusively in 2017 will be displayed.
Both
the
conditions are illustrated in the image below with red representing vegetated pixels and
white representing non-vegetated pixels.
In addition to this, the user can also compare two maps side by side by selecting different
years.
The same principle works in the case of water occurrence in Syria-Turkey border region.